At the beginning of 2025, Norway’s power supply had an installed production capacity of 40 334 MW, with an estimated normal annual production of around 157 TWh. The year 2024 set a new record with electricity production of 157.2 TWh, while 2023 had a total production of 154 TWh. In contrast, 2022 was marked by low precipitation and reduced inflow, resulting in a total electricity production of 146.1 TWh.
Installed production capacity refers to the maximum output a power plant or power system can produce, while normal annual production refers to the amount of electricity expected to be produced in a year with normal weather conditions.
Hydropower accounts for most of the Norwegian power supply, and the resource base for production depends on the precipitation in a given year. This is a significant difference compared to the rest of Europe where security of supply is mainly secured through thermal power plants, with fuels available in the energy markets. At the same time, Europe has in recent years seen an increase in weather-dependent electricity production such as wind and solar power.
A special feature of the Norwegian hydropower system is its high storage capacity. Norway has half of Europe’s reservoir storage capacity, and more than 75 % of Norwegian production capacity is flexible. Production can be rapidly increased and decreased as needed, at low cost. This is important because there must be a balance between production and consumption at all times in the power system. The growing share of intermittent production technologies, such as wind and solar, makes it even more vital that there is flexibility available in the rest of the system.
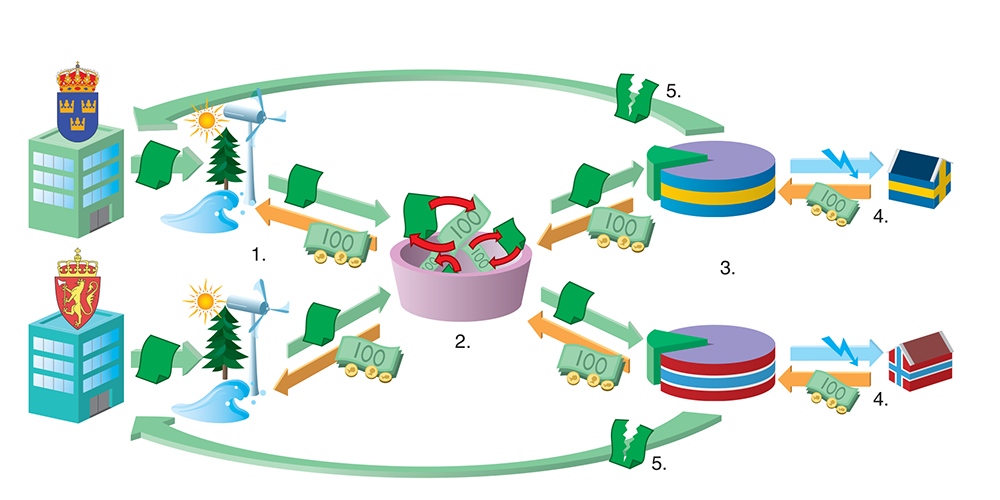
The power market in Norway was deregulated in 1991, when few countries had market-based power systems. The market is now a fundamental element of the Norwegian power supply. Electricity prices provide long-term investment signals and play an important part in short-term balancing of supply, demand and transmission.
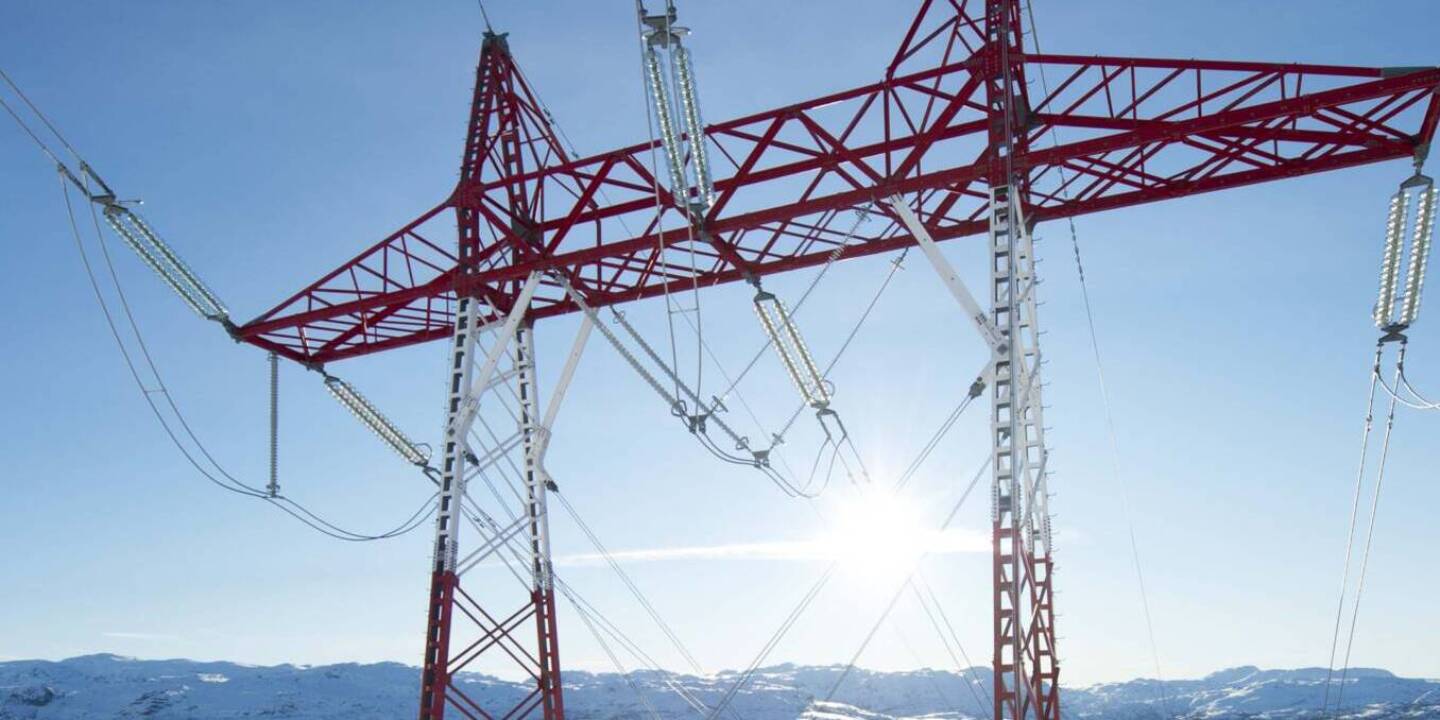
Renewable power plants are generally located where there is access to resources. Production capacity is therefore unequally distributed between different regions of Norway. A well-developed power grid is vital for transmitting electricity to consumers in all parts of the country.
The Norwegian power system is closely integrated with the other Nordic systems, both in physical terms and through market integration. In turn, the Nordic market is integrated with the rest of Europe through cross-border interconnectors to the Netherlands, Germany, the United Kingdom, the Baltic states and Poland. Integration with other countries’ power systems, the well-developed power grid and the characteristics of hydropower production make Norway’s power supply system very flexible, reducing vulnerability to fluctuations in production between seasons and years.
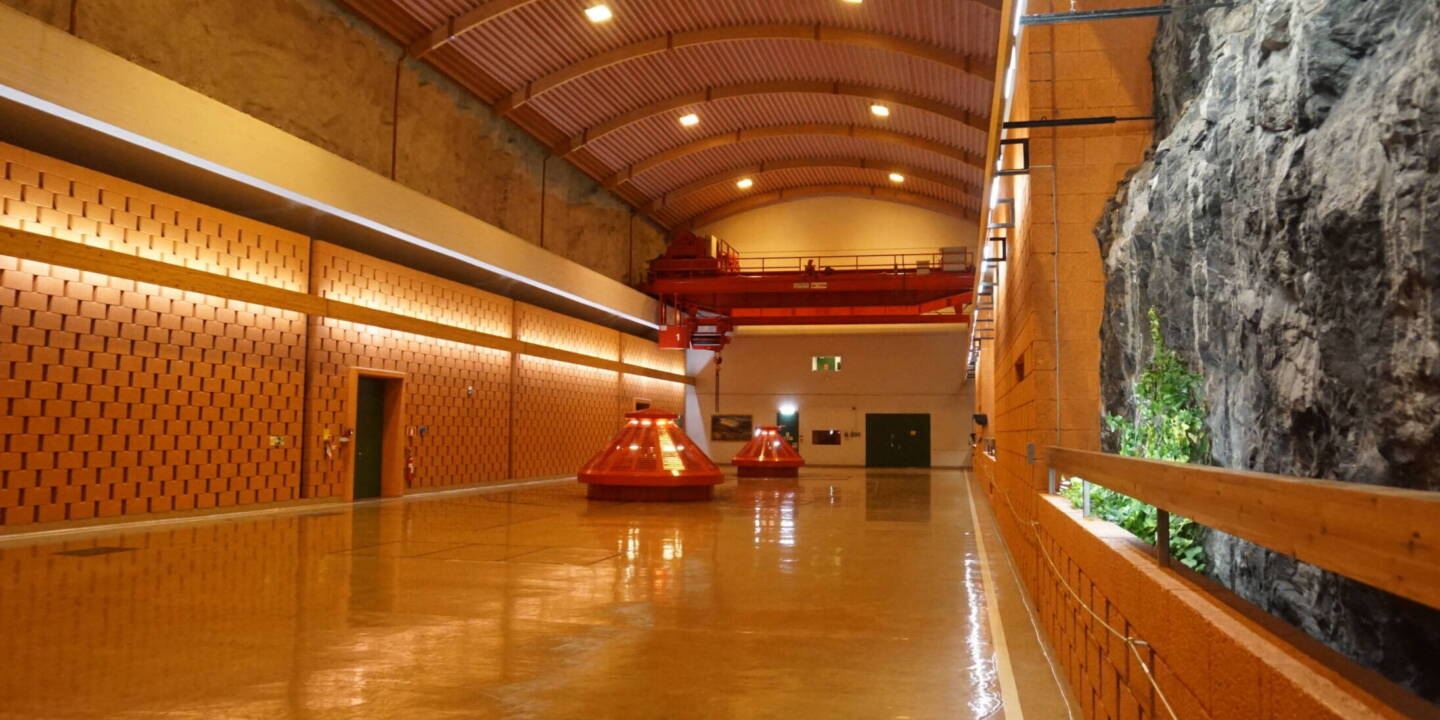
Hydropower
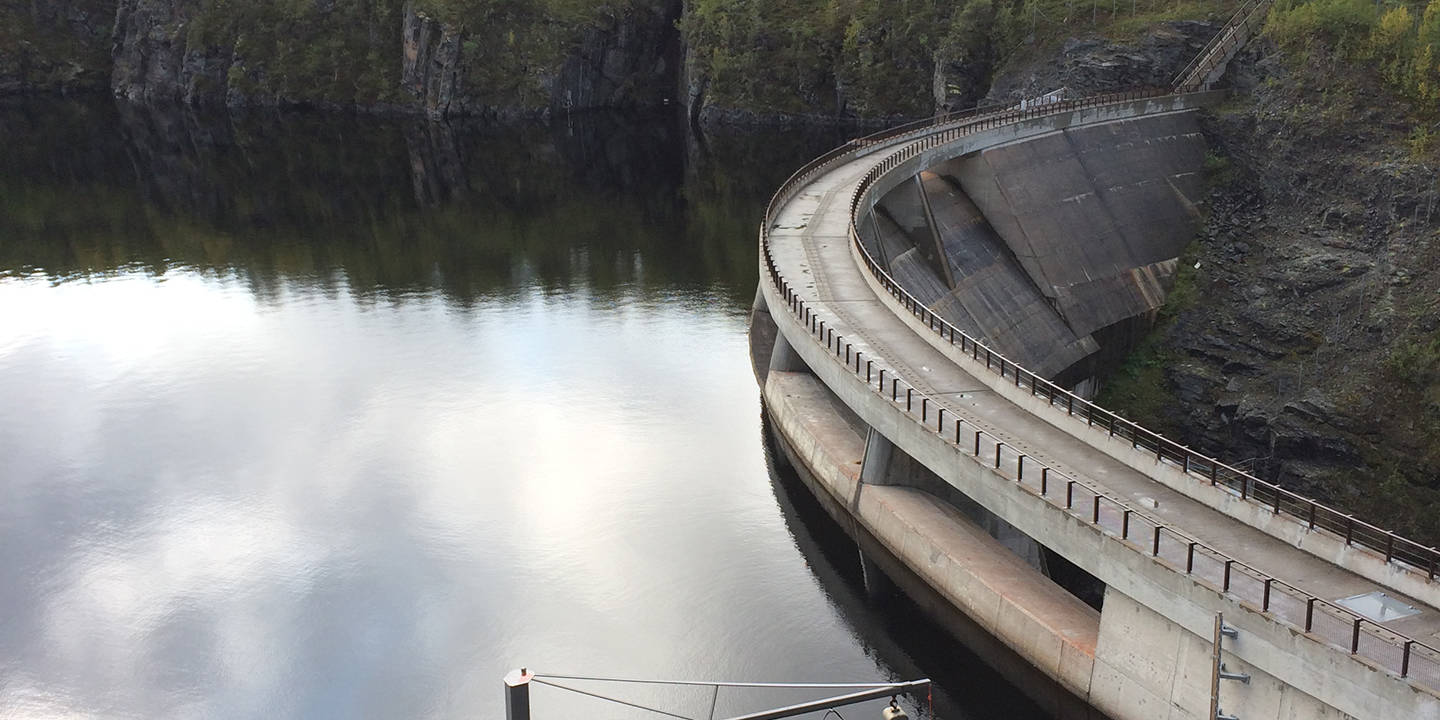
Hydropower is the backbone of the Norwegian power system. Today, 1,791 hydropower plants account for approximately 88 percent of Norway’s total normal annual electricity production. As of the beginning of 2025, the total installed capacity for Norwegian hydropower was 33,947 MW.
Water inflow and installed production capacity form the basis for what Norwegian hydropower can produce. The amount of inflow varies significantly throughout the year and from year to year. The water inflow is highest during the spring, normally declines towards the end of summer but increases again during the autumn. Inflow is generally very low in the winter months.
The hydropower system had a normal annual production of 137.6 TWh at the start of 2025. This figure is calculated by NVE and is based on observed inflow data over a longer period. The reference period used is 1991–2020.
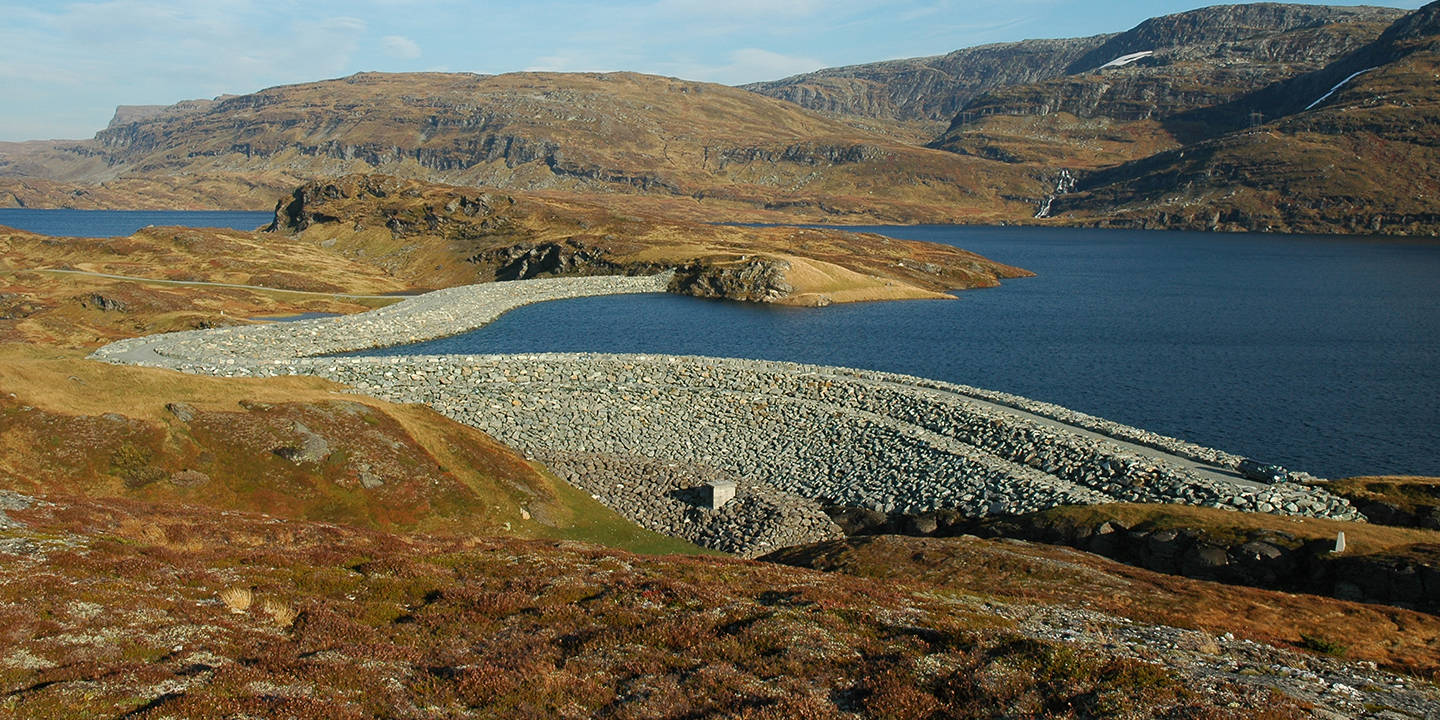
Norway currently has around 1 100 water reservoirs with a total storage capacity of over 87 TWh. Approximately half of this storage capacity is covered by the 30 largest reservoirs. Most of the reservoirs were built before 1990. Upgrades and expansions of the power plants have improved the ability to utilize these reservoirs.
Inflow, consumtion and production of electricity in Norway, 2024
Updated: 03.04.2025
Source: NVE
Print illustration Download data Inflow, consumtion and production of electricity in Norway, 2024 Download PDF Download as image (PNG)
Electricity production capacity is generally split into two categories, flexible and intermittent. If production is flexible, power plants can adjust production to market developments. Many power plants in Norway have storage reservoirs and production can therefore be adjusted within the constraints set by the licence and the watercourse itself.
Wind and solar power are intermittent; electricity can only be generated when the energy is available. The same applies to run-of-river power plants and small-scale hydropower plants. However a number of the large run-of-river power plants in Norway lie downstream of storage hydropower plants in the same river system, and this influences their production patterns. Some small hydropower plants make use of the head of water between reservoirs.
More than 75 % of Norway’s production capacity is flexible.
By using storage reservoirs, flexible hydropower plants can produce electricity even in periods when there is little precipitation and inflow is low. The large available reservoir storage capacity makes it possible to even out production over years, seasons, weeks and days, within the constraints set by the licence and the watercourse itself.
Production of intermittent hydropower automatically varies with changes in water inflow. Production is high during spring and summer, when consumption is lowest.
The flexibility of power plants and reservoirs varies. Some hydropower plants with small reservoirs offer short-term flexibility, and can transfer production from base-load hours (at night) to peak-load hours (daytime). Hydropower plants with larger reservoirs can store water for longer periods so that they produce electricity in winter, when consumption and prices are highest. Norway’s largest reservoir, Blåsjø, has a capacity of 7.8 TWh and can hold three years’ normal inflow. However, when the hydropower plants are working at full capacity, the reservoir could be emptied in 7–8 months. Very large reservoirs like Blåsjø are intended to store water in years when precipitation is high for use in drier years. Much of Norway’s reservoir capacity is concentrated in the mountains in the southern half of the country (in the counties Telemark, Rogaland, Hordaland and Sogn og Fjordane), and further north in Nordland.
Reservoirs make it possible to manage water use to maximise income from the available water resources. For society as a whole, the aim is to spread production so as to make optimal use of water inflow over the year, or in some cases over several years. To ensure that this happens, there must be financial incentives for producers that reflect the underlying physical conditions. The market therefore plays an important part in ensuring efficient management of water stored in the reservoirs.
The variable costs of hydropower production are low, since water, the actual energy source, is free. An owner of a run-of-river power plant will therefore be willing to generate electricity even if the prices is only just above zero. The same principle applies to intermittent production technologies such as wind and solar power. Intermittent production is generally independent of price, but varies with weather conditions. Thermal power production, for example at coal-fired, gas-fired and nuclear power plants, is profitable provided that the electricity price covers the production costs at the time of production. These depend to a large degree on the prices of coal, gas and CO2 emission allowances.
Hydropower producers who can store water will assess the situation differently. They constantly need to consider whether to produce electricity immediately, or to retain the water in reservoirs. It is the difference between the current and the expected electricity price that determines whether it is profitable to store water for short or longer periods.
It is challenging to manage storage reservoirs, because it is impossible to be sure how inflow will vary in future or how market conditions will develop. Reservoir management therefore requires considerable local knowledge and the ability to interpret changing, complex and uncertain information on inflow, consumption and market developments.
At Norwegian storage hydropower plants, production is also regulated in line with short-term price developments, which are closely related to the volume of intermittent power production in the other Nordic countries and the rest of Europe.
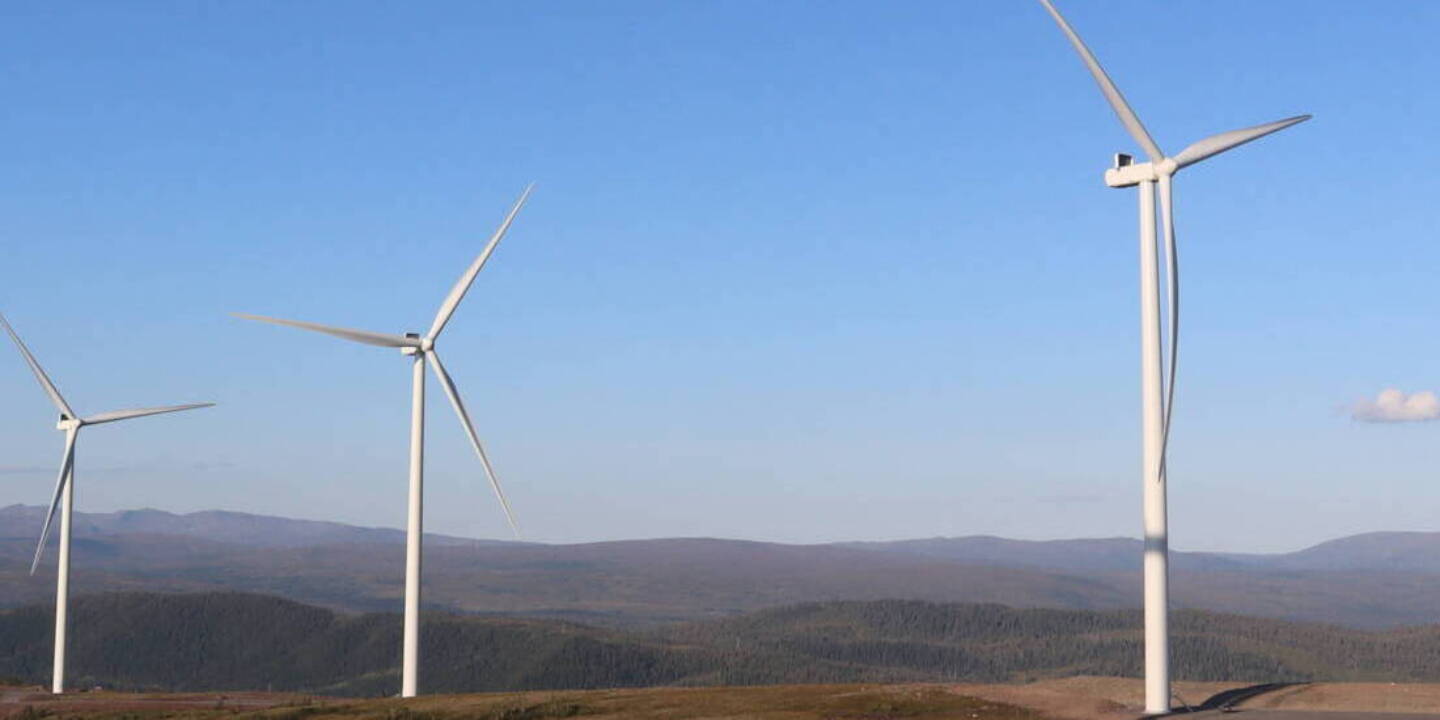
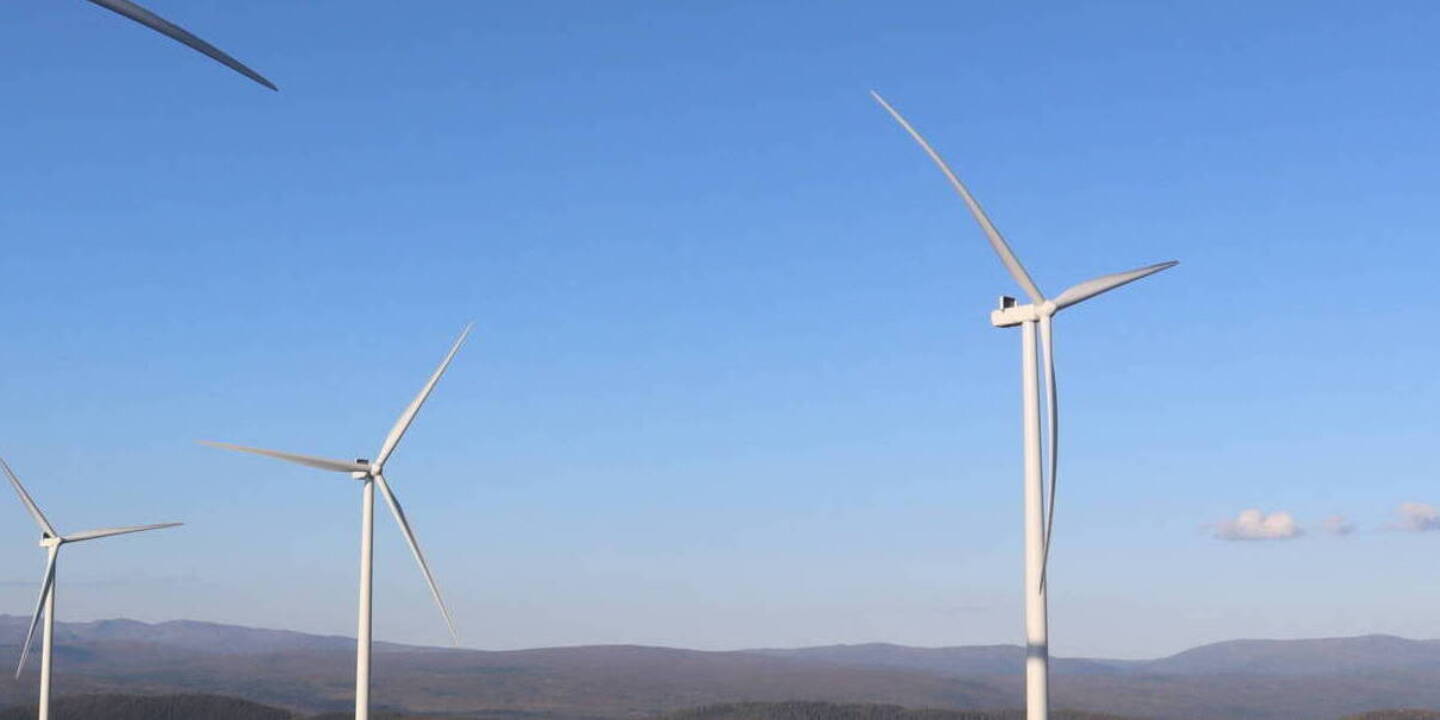
Wind power
As of the beginning of 2025, there were 65 wind farms in Norway with a total of 1 392 turbines. These wind farms had a combined installed capacity of 5 082 MW and a normal annual production of 15.9 TWh. This accounts for approximately 11 percent of Norway’s total electricity production capacity. Electricity generation from wind power varies with weather conditions. Wind conditions can fluctuate significantly from day to day, week to week, and month to month. Wind power development peaked in 2020, when 5.3 TWh of new capacity was commissioned across 18 wind farms.
Wind power production in Norway
Updated: 23.04.2025
Source: SSB
Print illustration Download data Wind power production in Norway Download PDF Download as image (PNG)
Offshore wind
The government aims to contribute to the development of new industries on the Norwegian continental shelf and is following up on its ambitions for offshore wind. Through its focus on offshore wind, the authorities want to promote increased emissions-free power production in Norway. The initiative also aims to facilitate innovation and technology development and contribute to industrial growth.
In 2020, Southern North Sea II and Utsira Nord were opened as the first areas on the Norwegian continental shelf for renewable offshore energy production. Southern North Sea II is located at the very southern end of the North Sea, near the border with Denmark. The area is suitable for fixed-bottom offshore wind. Utsira Nord is located in deeper waters off the coast of Rogaland and is best suited for floating offshore wind.
In March 2024, Norway held its first offshore wind auction. The auction concerned a project area in Southern North Sea II. The company Ventyr SN II AS won the auction. Ventyr is a consortium owned by Parkwind and the Ingka Group. The company will be granted the project area and thus a time-limited exclusive right to carry out a project-specific environmental impact assessment and to apply for a concession under the Offshore Energy Act. The state will support the project with up to NOK 23 billion (2023 kroner). The support will be provided through a two-way contract for difference with a 15-year duration from the start of production.
In May 2025, the Ministry of Energy announced the opening of Utsira Nord, which will be Norway’s first large-scale floating offshore wind project. The application deadline was September 15, 2025, and the ministry received two applications. Actors awarded areas will have the opportunity to further develop their projects during a maturation phase before participating in a competition for state support. The state support will be provided as investment grants and cannot exceed a cost framework of NOK 35 billion (2025 kroner).
The further development of offshore wind depends on access to suitable areas. In June 2025, NVE submitted a strategic environmental impact assessment of areas suitable for offshore wind. The assessment was sent out for public consultation, and based on the report and feedback from the consultation, the government will prepare a plan for the future development of offshore wind.
Solar power
As of the beginning of 2025, the total installed capacity for solar power in Norway was 767 MW. In 2023, over 90 percent of the solar power capacity was connected to the Norwegian power grid. Around 5 percent of solar installations in Norway had an installed capacity of more than 50 kW in 2023. These accounted for approximately half of the total production capacity of solar installations in the country. Most solar installations are rooftop systems installed on private homes and industrial buildings, primarily covering the owners' own electricity consumption. In recent years, there has been growing interest in ground-mounted solar power plants.
Development in grid-connected installed capacity for solar power in Norway
Updated: 23.04.2025
Source: Elhub and NVE
Print illustration Download data Development in grid-connected installed capacity for solar power in Norway Download PDF Download as image (PNG)
Thermal power plants
Norway’s thermal power plants accounted for about 1.5% of the total production capacity in 2025. Many of the power plants are located in large industrial installations that use the electricity generated themselves. Hence, production often depends on the electricity needs of the industry. These power plants use a variety of energy sources, including municipal waste, industrial waste, surplus heat, oil, natural gas and coal. There are 30 thermal power plants in Norway, with a total installed capacity of about 538 MW.
The power balance
The power balance expresses the relationship between production and consumption and indicates whether the Norwegian power system is a net exporter or importer in a particular year. There are wide variations from year to year. Generally, consumption fluctuates with temperature and production with water inflow and wind conditions. The underlying situation in the Norwegian power supply system can be illustrated by comparing Norwegian production capacity in a normal year with electricity consumption corrected for temperature, as in the figure below.
At the beginning of the 1990s, there was a considerable surplus in the Norwegian power supply system, which became apparent when the market was deregulated. This was followed by a period of falling investments in new electricity production and relatively high growth in consumption, resulting in a reduction in the power surplus by the early 2000s. After the 2008–2009 financial crisis, the power surplus has increased again as a result of weaker growth in consumption and higher electricity production. In 2024 Norway had a power surplus of 18 TWh, which is a historically large surplus of power. At the same time, there is uncertainty about how this surplus will develop in the coming years. This depends on consumption trends and the extent to which new power production will be realized in Norway.
Normalized production and consumption of electricity 1990-2020, TWh
Updated: 23.02.2021
Source: NVE, Nordpool
Print illustration Download data Normalized production and consumption of electricity 1990-2020, TWh Download PDF Download as image (PNG)